Stone Fabricator Market Forecast for 2018
Growth in the stone market, along with investments in equipment and personnel, expected in 2018.
Once again, Stone World polled fabricators from various-sized shops situated throughout the U.S. in its annual purchasing plan survey conducted by the Market Research Department at BNP Media (Stone World’s parent company). Similar to last year, three-quarters of the respondents anticipate positive results in the coming year — with sales revenues expected to increase in 2018 by an average of 19%.
2018 forecast
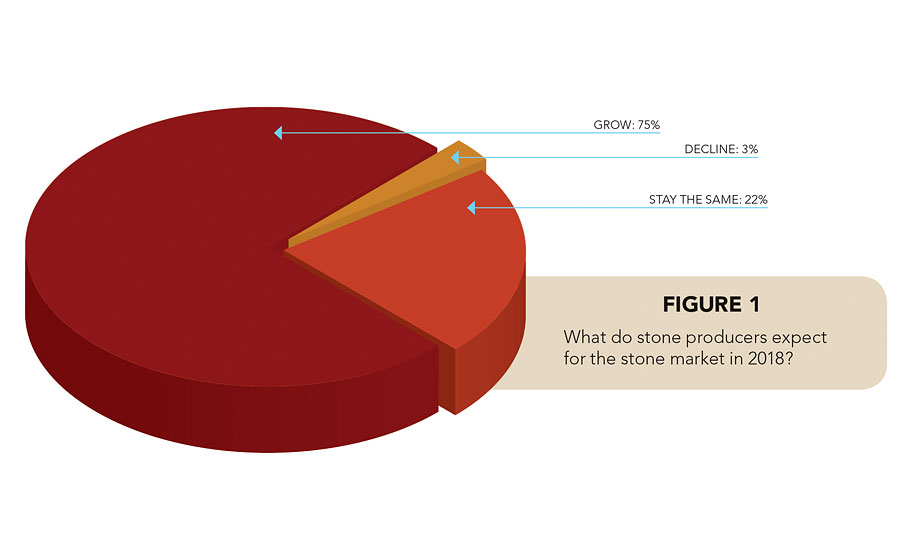
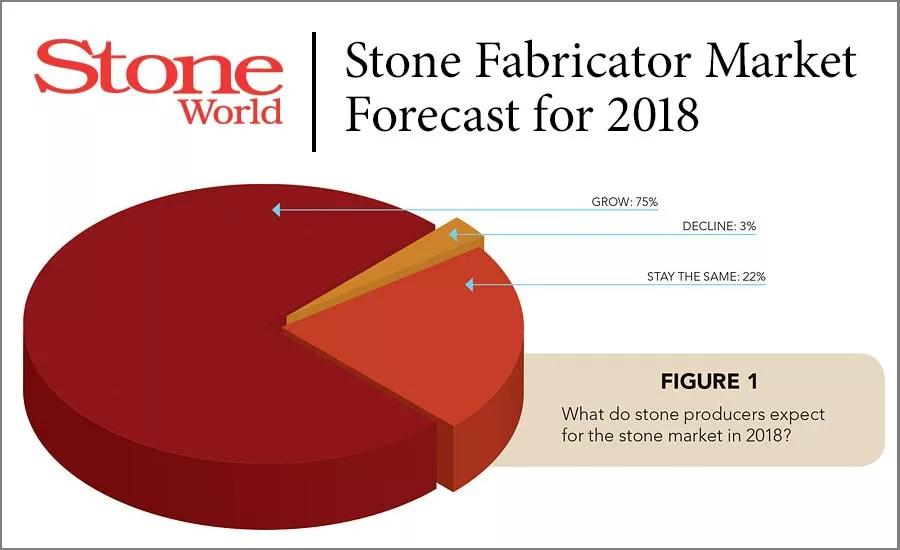
The recent survey showed a total of 75% expected sales revenue to grow in 2018, which is actually down 1% from the 76% who were optimistic last year. Another 22% said the market would remain status quo, while the other 3% believed that there will be a drop in sales revenue. The mean average of 19% growth is a 2% increase from last year’s results.
There are multiple factors attributing to the upbeat market perception, including an increase in consumer demand, coupled with companies expanding into different areas, as well as an overall construction boom, paired with an improved economy.
“Focusing on targeting new business and new equipment gives us a competitive edge,” said one fabricator. While another participant noted, “Remodeling is taking off in our area; baby boomers are not moving but renovating. Granite is expected even in low-end houses.”
And although natural catastrophes, such Hurricane Harvey that caused massive destruction in the Houston, TX, area this past fall, were devastating, residents in this region are rebuilding. As a result, a demand has been created for stone fabrication services.
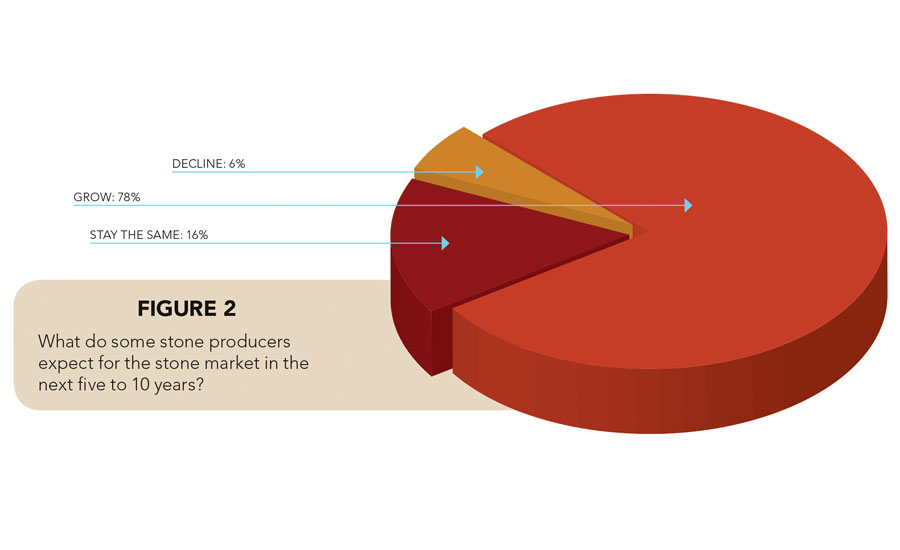
Among those participating in the Stone World survey, three-quarters also have high hopes for the next five to 10 years. A total of 78% believe the market will continue to increase by an average of 16%. Respondents this year are slightly more cautious than those polled in 2016, as 83% believed the market would rise in 2017. A total of 16% said the stone market will remain stable during the next five to 10 years, and 6% say there will be a decrease over the next five to 10 years.
An increasing trend towards demand for natural stone and quartz surfacing, along with the recent drop in stone prices, are mainly attributed to the expected growth in the stone market over the next three to five years. Overall, increase in consumer demand is also considered to be the next biggest reason for expected growth.
“For the next five years, overall, I believe quartz and granite will still be the common materials for kitchen countertops,” stated one participant. While another said, “There is more of a demand for quality natural products.”
Additional comments included:
- There is a strong economy, low unemployment and very strong consumer confidence and spending
- Great incentive for tax cut
- More technology and an increasing market demographic
- Just an educated guess
Investing in technology
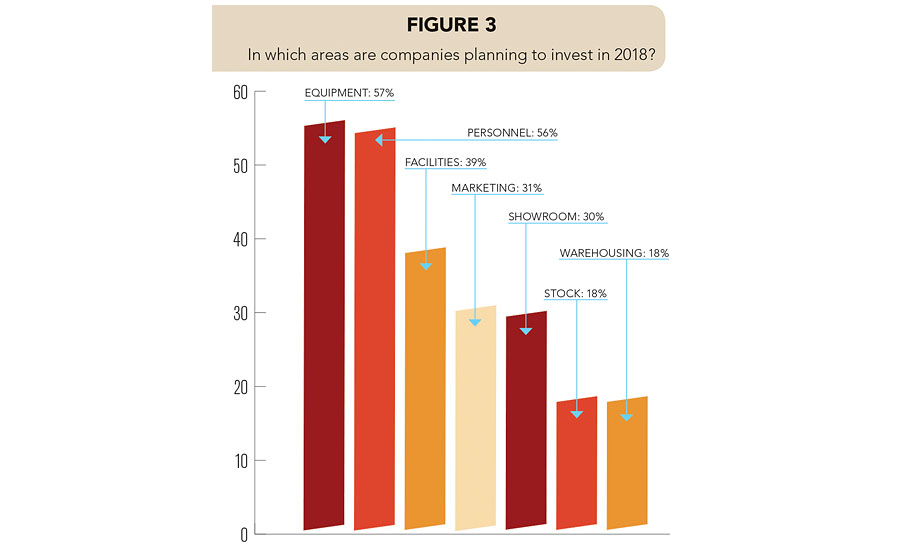
Many fabricators plan to make investments in equipment in 2018, although the 57% who said they would is down from last year’s reported 73%. Investment in personnel sees a big jump though in 2018 — rising from 35% to 56%. Additional breakdown in the percentages of spending are: 39% facilities, 31% marketing, 30% showroom, 18% stock and 18% warehousing. A total of 5% have no plans to invest next year — quite a bit down from last year’s reported 11%.
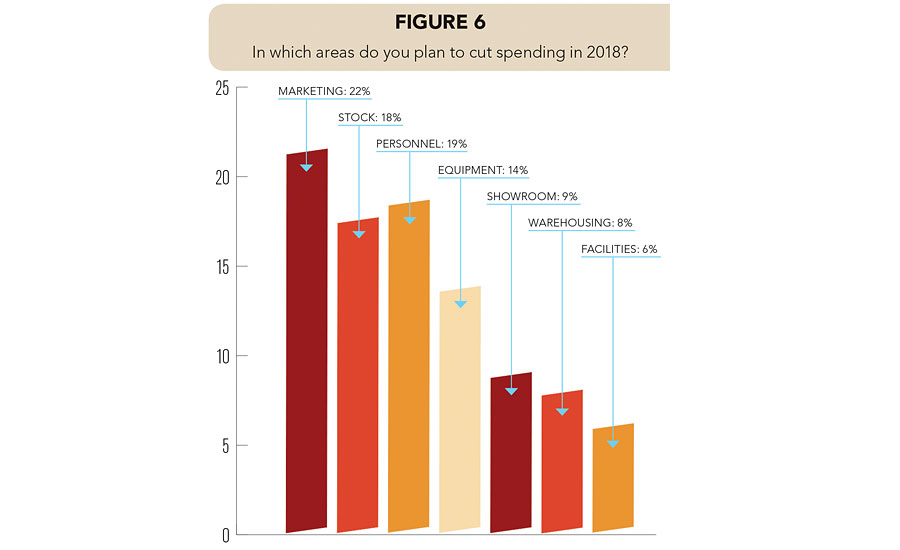
Spending cuts remain minimal in 2018. Among areas some fabricators will pull back on are: marketing (22%), personnel (19%), stock (18%), equipment (14%), showroom (9%), warehousing (8%) and facilities (6%).
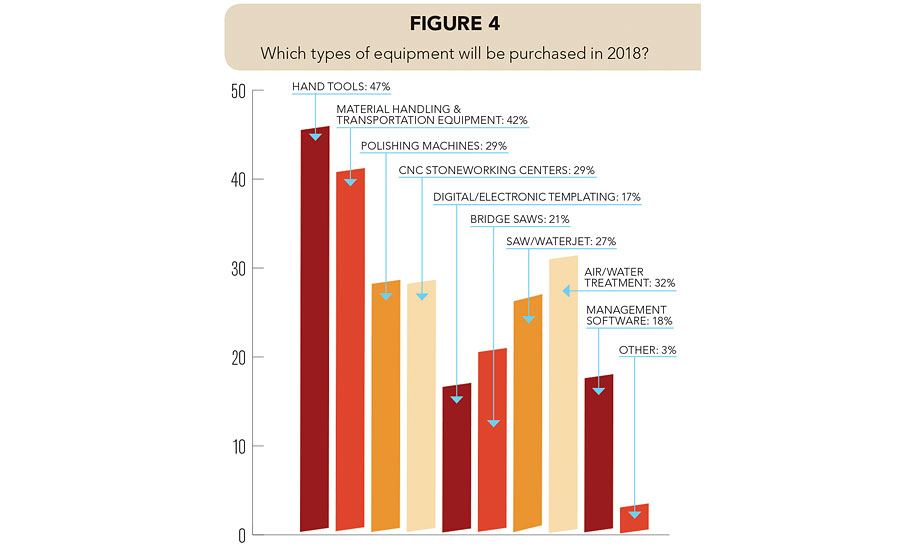
Looking at specific equipment that fabricators are planning to make an investment, hand tools continue to rank as the most popular equipment on the purchase plan in 2018 (47%), followed by material handling and transportation equipment in a close second at 42%. A total of 32% of respondents intend to buy an air/water treatment system, which is a significant climb from the 12% showing interested in this area last year. When it comes to equipment, other areas of interest are polishing machines (29%), CNC stoneworking centers (29%), saw/waterjets (27%), bridge saws (21%), management software (18%), digital/electronic templating (17%) and other (3%). Of the group surveyed, 9% do not plan to purchase any equipment in 2018.
Statistics show the average spending on hand tools in 2018 is expected to be $8,047, while responding companies anticipate investing $26,717 in material handling and transportation equipment and $62,632 in polishing machines. These figures plummeted from last year’s predictions, which were $14,769, $49,350 and $76,778, respectively. Moreover, the fabricators polled anticipate spending an average of $122,015 on bridge saws, $48,590 on air/water treatment systems, $145,537 on saw/waterjets and $177,100 on CNC stoneworking centers.
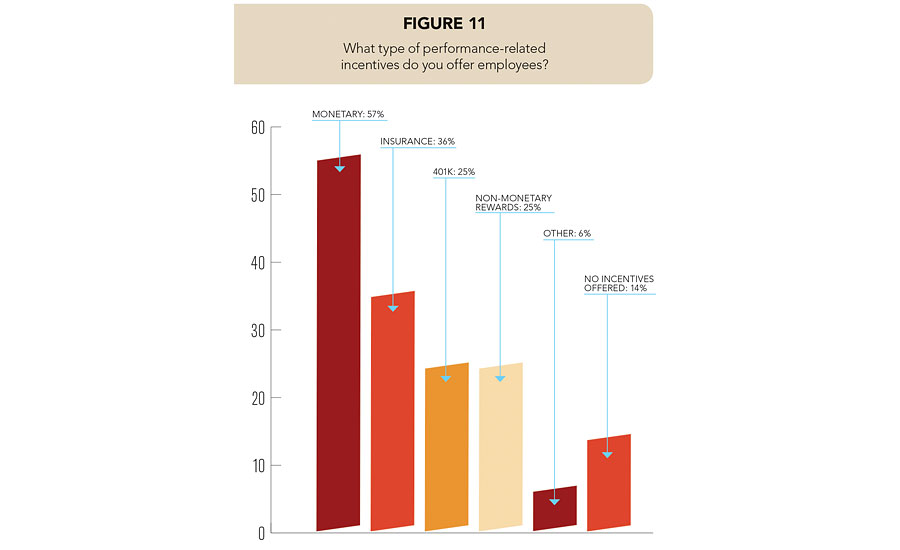
Since personnel continues to be a priority to fabricators each year, last year Stone World included a new question which asked fabricators if they offer performance-related incentives to their employees. While a total of 57% said they give monetary rewards (down 2% from 2016’s results), 36% offer insurance (compared to 39% in 2016), 25% provide a 401K (up 1% from last year’s survey) and 25% offer non-monetary rewards such as extra vacation time (an increase of 5% from 2016). A total of 14% said they do not offer any incentives to employees, compared to 15% in 2016.
Reflecting on 2017
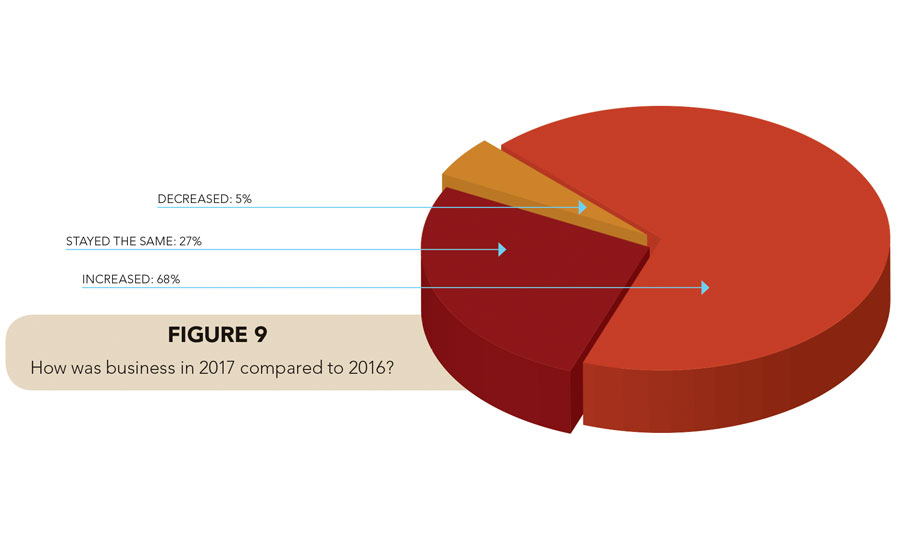
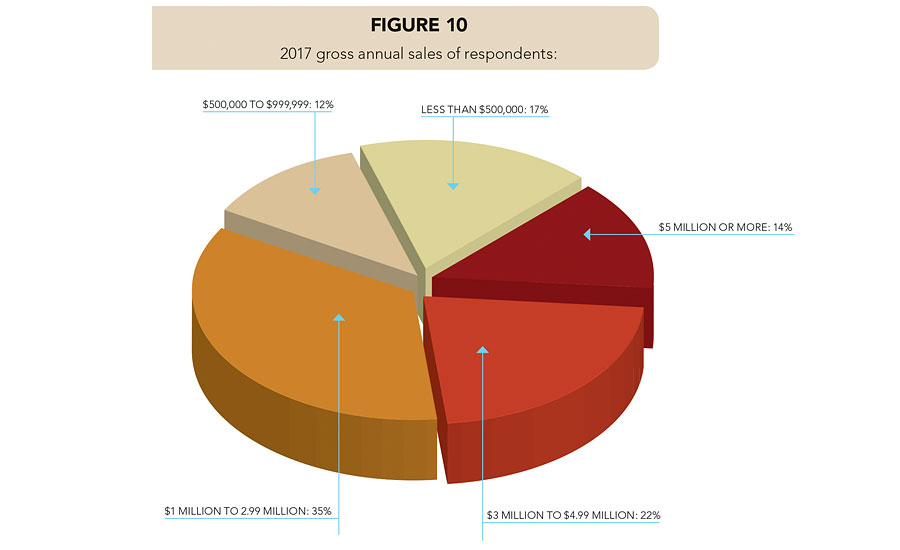
The majority of respondents (73%) expect their gross annual sales to increase in 2018, which is slightly higher from last year’s 71% and a definite rise from the 67% the year before. A total of 57% of respondents’ companies gross annual sales are expected to be anywhere from $1 million to less than $5 million in 2018, while 14% of respondents anticipate their sales to be $5 million or higher. Overall, the majority of participants have indicated an increase in their companies’ gross annual sales this year, with an average increase of 30%. More than two out of five respondents reported their companies’ 2017 net profit to be more than 10% and two-thirds of them (64%) anticipate a larger net profit next year.
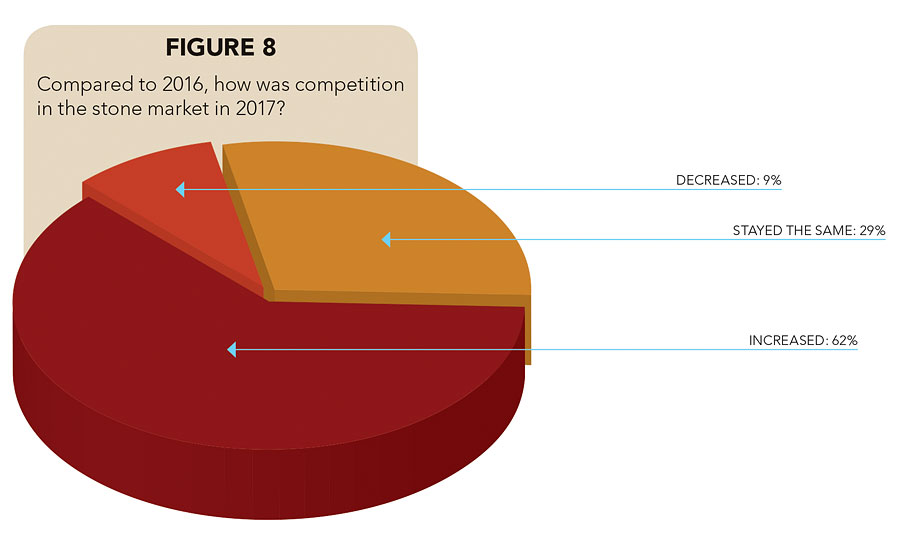
Competition among other stone fabricators continues to escalate each year. The 2017 survey results show 62% feel this way, while the statistics were 61% in 2016, 55% in 2015 and 41% in 2014. Competition from low-end fabricators remains the greatest challenge for many fabricators at 49%, while 23% of respondents feel smaller margins on current products and services rank among the biggest challenges, 10% cite changes in the residential housing industry and 9% believe competition from alternative countertop materials, such as Corian, concrete and wood play a factor.
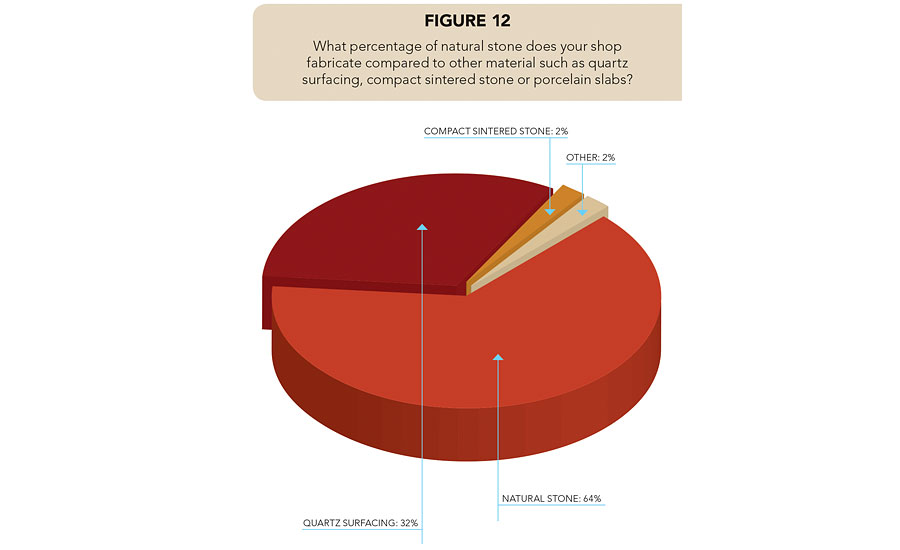
When it comes to material, on average, nearly two-thirds of respondents (64%) cut natural stone, while a third (32%) cut quartz surfacing. While compact sintered stone and porcelain products are also gaining popularity in the market, only 2% of the fabricators polled cut those materials.
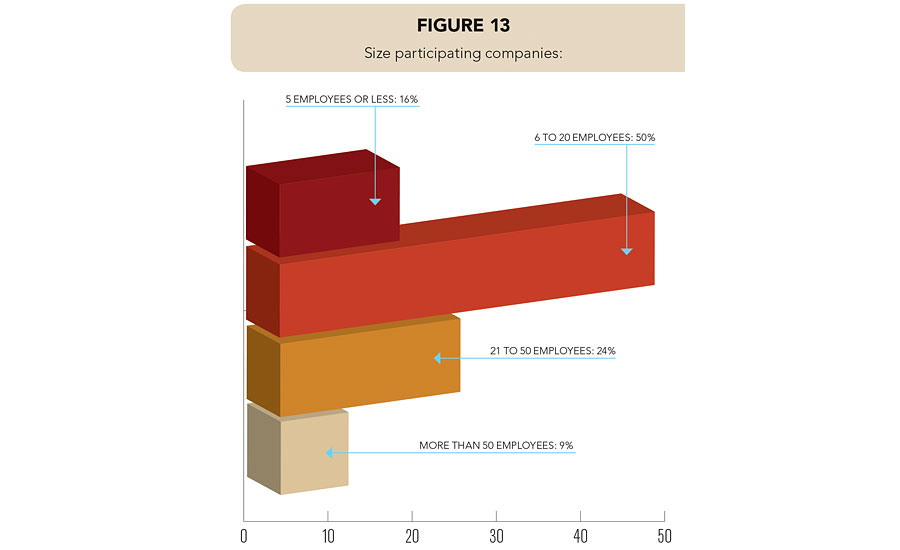
Of those responding to the Stone World fabricator survey, 16% have five employees or less, 50% have a staff of six to 20 employees, 24% have 21 to 50 employees and 9% have more than 50.
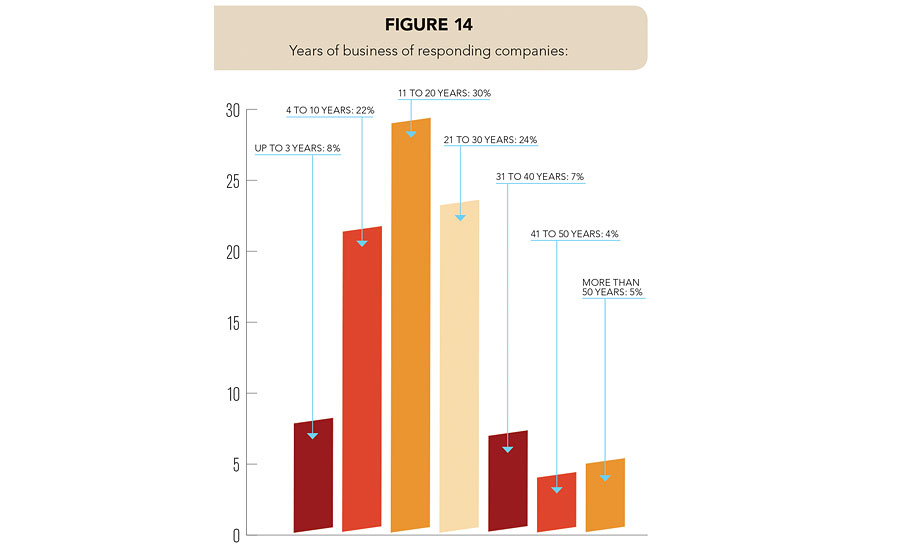
majority of those polled (30%) have been in business between 11 and 20 years. The largest percentage of fabricators polled (39%) are located in the south, while 21% were from the Northeast, 23% from the Midwest, and 17% from the West.
Looking for a reprint of this article?
From high-res PDFs to custom plaques, order your copy today!


