
While Spain has long been a dominant world supplier of
granite, nations such as India have also become major players in the
extraction, production and supply of granite. Photo courtesy of PRP Exports
This article illustrates one way the data in the “Compendium of World Dimension Stone Data” can be analyzed. It uses an advanced statistical technique - several regression projections - to estimate the production of dimension granite for two major producing countries, Spain and India, in 2014. The actual data for both countries is unlikely to be released before 2017 or 2018, so this is a very advanced look at what the data could well be.
Data, Technique and Sources
The source of most of the data used in the regression projections is the “Compendium of World Dimension Stone Data” (available from Marble Institute of America). The Compendium covers all of the major producing nations for granite, marble and other stone materials, and it covers most of the medium-sized producing nations as well as a few of the smaller producers. Most of the major granite producers have attained that status quite recently, except for Italy and Spain, the long-time dominant producers in the world granite market before 1990 to 1995. Among the major world granite producers covered in the Compendium are Spain and India, along with Italy, Brazil and China.Spain has been a long-time major international dimension granite producer, and India is one of the newer major producers. The dimension granite production data for both Spain and India from 1997 to 2004 comes from the table under Graph 2 for World Granite Production; the granite production data for those nations from 2005 to 2007 was estimated from Table 4, both being in the Compendium. The data is originally derived from respected Italian and U.S. Geological Survey sources as well as from Spanish and Indian sources. The world dimension granite demand index series for 1997 to 1999 has been newly calculated from raw data on the same basis as the 2000 to 2006 series in Table 2 in the Compendium, and the 2007 to 2009 world granite demand index is from the “Dimension Stone Advocate News” or its linked update blog.
The simple regressions used here require 8 to 10 data points for statistical validity. The regression feature in the Excel Analysis Toolpak was used to create the projection equations and calculate the r2 (r-squared).
Independent and Dependent Variables
Both Spain and India had regressions for two independent variables: (1) the average world granite demand index (1997 to 2007) and (2) a time series in units of calendar years (i.e. 1997, 1998, 1999, etc.). Empirically, the dimension granite production for both countries should parallel the world granite demand index, since both countries are major granite exporters. When they are an independent variable, the time series in general usually has a strong correlation with any dependent variable data series, such as the ones used here. The dependent variable for each country is its dimension granite production.
The Results for 2012 and 2014
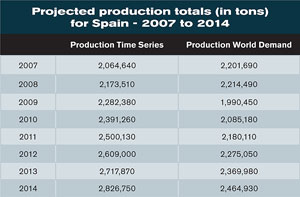
The latest available world dimension granite demand index was for 2009, so 2009 is the most recent year with comparable values. The projected granite production values for 2009 for Spain using time (in years) or using the world granite demand index were quite different; the time series gave a 2009 Spanish dimension granite production of 2,282,382 tons, and the granite-demand variable gave one of 1,990,453 tons: both the r2 were very strong and close to the same: 0.91 for time and 0.92 for granite demand. This difference is the result of the world granite demand index reflecting the Great Recession and the time series ignoring it while assuming a strongly expanding economy, as it had been in 2007 and before. The 2009 demand-based projected granite production most clearly reflects reality and will be used for adjustment; it was 87.2 percent of the time-based production. Accordingly, the 2012 granite production of 2,609,000 tons (time-based) is adjusted to 2,275,050 tons, and the 2014 granite production of 2,826,745 (time-based) is modified to 2,464,920 tons.When Indian granite production data is analyzed by regression against the time series, 2014 granite production is 11,747,500 tons, 2012 production is 10,841,073 tons, and 2009 production is 9,481,430 tons. Using Indian dimension granite production in a regression against world dimension granite demand yields a 2009 Indian granite production of 8,299,250 tons for the latest comparable year. The difference is again the result of the world granite demand showing the Great Recession, while the time series does not. The r2 for the time-Indian granite production regression is 0.95 and for the world granite demand-Indian granite production is 0.98. The 2009 world granite demand regression yields a 2009 value of 87.5 percent of the 2009 time-based regression. Accordingly, the best estimate for 2014 Indian dimension granite production needs to be adjusted for the world granite demand (0.875 of time-based demand) or 10,279,060 tons and the best estimate for 2012 would be 9,485,940 tons.
To summarize, the adjusted 2014 dimension granite production of Spain is 2,464,920 tons, and the adjusted 2014 granite production of India is 10,279,060 tons. From 2007, the Spanish dimension granite production to 2014 has grown 23 percent, and the Indian production to 2014 has grown 9 percent. The r2 for both Spain and India, both for time and demand, show an excellent fit and very strong correlation.

