Despite recent slowing in the housing market, businesses operating in the stone industry continue to make money. Importers, fabricators and installers have been scrambling to keep up with the public’s voracious demand for stone - despite higher costs than other countertop, flooring and wall covering options. Consumers are seduced by stone’s beauty and intrigued by its origin, a product of Mother Nature formed over millions of years. And they cannot resist stone’s functionality and durability. These qualities are perceived as added value, and as a result, consumers are paying an average of six times more for stone than they do for its closest rival, ceramic tile.
The newStone Product Industry Report 2006tells you why the future looks rosy and examines leading current trends. Data for the stone industry has historically been in short supply, prompting Ceramic Tile And Stone Consultants, LLC (CTaSC) to join forces with Catalina Research, Inc. and conduct an in-depth study. Known for its comprehensive ceramic tile and floor covering market reports, Catalina Research, Inc. is a well-respected research firm. The first edition of theStone Product Industry Reportappeared in 2003 and the newest version was published in March 2006. TheStone Product Industry Report 2006is a 214-page study that provides valuable insight into the U.S. stone industry’s explosive growth and is an essential tool for developing effective business plans or for attracting outside investors.
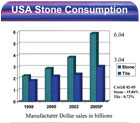
When preliminary numbers were tallied, it was revealed that in 2005, stone value had reached an all-time high of $6.04 billion of manufacturers’ dollars in total U.S. supply, a 15.4% compound annual growth rate (CAGR) from 1998 to 2005. Ceramic tile, on the other hand, enjoyed sales of $3.04 billion in wholesale dollars and a CAGR of 8.7% for the same period (see Table 1).
In terms of square feet, preliminary figures show that there were 3.21 billion square feet of ceramic tile sold in the U.S. in 2005 and 956 million square feet of stone (see Table 2). This stone figure may initially seem low compared with tile, but it must be seen in the context of growth potential. While ceramic tile consumption increased an admirable 21.2% from 1992 to 2005, stone rocketed up 69.1% during the same period. Stone value averaged $6.16 per square foot in 2005, and ceramic tile averaged only $0.95 per square foot. Businesses readily understand the math; the rate of return and profit are much greater on the higher priced stone products.
The data overwhelmingly affirms that stone is on a confident, if not amazing, upward climb. This is great news for people in the industry. The difference in ceramic tile being consumed 3.36 times more than stone in terms of square feet is only an indication of the potential for the stone market. That doesn’t take into consideration that stone currently dominates the countertop market. Stone’s higher dollar value means higher profit potential at all levels.
Why is stone selling so well? According to theStone Product Industry Report 2006, the cost of stone per square foot has declined 9% in value since 2002. The average cost of stone was $6.77 per square foot in 2002; by 2005 it had dropped to $6.16 (see Table 3). One of the reasons for this change is due to the large supply of lower-cost imported rough and worked stone that has become available on the market from countries such as China, Brazil, Turkey and India. In addition, there is new technology and improved stone processing equipment that make production at quarries and processors more efficient, thereby further lowering costs. These savings are being passed on to consumers, making stone more accessible and affordable.
In 2005, stone imports grew to $3.34 billion, making up about 55% of total U.S. stone consumption. Italy is still the leading supplier of foreign stone, representing 21.2% of imports and shipping $707 million of stone products to the U.S. in 2005. Italy has been losing ground since 2002, however, when it held a 33% market share of imports. This is due to aggressive efforts on the part of other countries to ship lower-cost stone to the U.S. Brazil now represents 17.7% of imports, while China is at 13.8%, Turkey is at 13.6% and India is at 11.3% (see Table 4). Of course, stone is frequently quarried in one country and then shipped to another for processing. In this vein, Italy is accustomed to handling large volumes of stone and is a top processor of blocks due to its skilled work force and advanced technology. However, China, Brazil and India are rapidly making progress given their low-cost labor advantage, their ability to train people and their means with which to buy technology.
Stone sales were driven by record new single-family home construction and existing home resales in 2005. Within this category, granite continued to dominate, representing 50.9% of the domestic supply of U.S. stone and 46.8% of stone imports (see Table 5). A significant portion of the U.S. granite consumption is used as countertops. In 2005, stone countertops represented 47.8% of the countertop market, which grew from only 33.8% in 2002 (see Table 6). The report estimates that countertops represented 26.8% of the total stone supply in 2005. Extrapolating from the stone report, the installed retail value of countertops works out to approximately $7.38 billion dollars - a huge market and one which is growing.
Even with the excitement resulting from the growth in the stone industry, there are still many challenges ahead. Since stone is being shipped from all over the world, and standards vary from country to country, there have been problems with quality control. Physical properties of stone taken from the same quarry can vary tremendously depending on the location and the timing of its extraction. This means that stone shipments from the same supplier can perform differently. It is the supplier’s responsibility to educate their customers about these differences. In the U.S., there are ASTM standards that establish standard grade material in each stone category. The reality, though, is that too few suppliers are testing their products. Stone suppliers should provide the results of these tests for their current inventory, and architects should require these test results as part of their quality control and performance requirements of their specifications.
Another challenge is the lack of enough skilled labor to install stone. The consumption of stone has grown many times faster than the labor force installing it. Add to that the fact that most installers learn on the job and are not adequately or properly trained with regards to industry standards and methods. There isn’t enough structured training available for installers, and today’s construction cycles move at such a quick pace that they have little time to learn about new products, etc.
Quality control and training issues must be managed to minimize the number of disgruntled stone consumers and curtail the growing number of lawsuits resulting from incorrect specifications of stone and installer error.
The good news is that theStone Product Industry Report 2006indicates that we have at least six years of robust stone demand. There will be plenty of new entrants into the industry as investors realize the opportunities and the high returns. Prices will continue to decline as supply increases and processors benefit from new technology and improved economy of scales. The stone report forecasts a 10.1% CAGR in value from 2006 to 2011 (see Table 7), which is a good indication of a healthy industry with many opportunities.
TheStone Product Industry Report 2006provides an analysis of factors driving U.S. demand that includes data trends of new residential and remodel construction, total housing demand, housing starts and permits, average price and size of new homes, number of bathrooms per home, remodel spending and other economic and demographic trends. The report has special sections on countertops, engineered stone, pre-cast concrete stone, stone flooring and more. There are also sections on the cost structure and profitability of U.S. stone quarries, processors and fabricators, and a section on machinery supply trends. A CTaSC anonymous web survey was conducted in the Fall of 2005 directed to importers and fabricators. Results of the survey are reported, providing data on customers and stone types and applications. Fabricators were asked about shop size, equipment types, brands and value, purchase and selling price of stone and more. Stone fabricators revenues are estimated to have increased at 12.6% CAGR from 2002 to 2005. Based on the report’s estimates, importers purchased the equivalent of 363.3 million square feet of modular stone tile in 2005, which represents approximately 38% of total imports. Data on the Canadian market is also provided in a separate section of the report.
Stone importers, fabricators, installers and other related businesses have much to look forward to in the years to come. The demand and opportunities in the stone industry are tremendous, provided certain challenges are met that will ensure the quality and reputation of the stone industry.